Debugging with Trace Viewer
A test fails in CI. The error message says "Element not found." You have no idea what the page looked like. Sound familiar? Playwright's debugging tools eliminate this guesswork.
Playwright Inspector
Starting the Inspector
# Debug a specific test
npx playwright test cart.spec.ts --debug

# Debug from a specific line
npx playwright test cart.spec.ts:25 --debug
The Inspector opens with:
- Browser window showing your app
- Inspector panel with test steps
- Locator picker tool
Inspector Features
Step through tests:- Click "Step Over" to execute one line
- Watch the browser react
- See which locator is being used
- Click the "Pick Locator" button
- Click any element in the browser
- Inspector suggests the best locator
// In Inspector console
page.getByRole('button', { name: 'Add to Cart' })  // See if it finds the element
page.locator('.cart-count').count()                 // Check how many match
Adding Debug Breakpoints
test('checkout flow', async ({ page }) => {
  await page.goto('/products/laptop');
  await page.getByRole('button', { name: 'Add to Cart' }).click();

  // Test pauses here when run with --debug
  await page.pause();

  await page.goto('/checkout');
  // ...
});
PWDEBUG Environment Variable
# Enable Inspector for all tests
PWDEBUG=1 npx playwright test

# Console mode (no GUI)
PWDEBUG=console npx playwright test
Trace Viewer
Traces are recordings of everything that happened during a test. They're essential for debugging CI failures.
Enabling Traces
// playwright.config.ts
export default defineConfig({
  use: {
    // Only record on first retry (saves CI time)
    trace: 'on-first-retry',

    // Or always record
    trace: 'on',

    // Or only when test fails
    trace: 'retain-on-failure',
  },
});
Viewing Traces
# After test run, open the report
npx playwright show-report

# Or open a specific trace file
npx playwright show-trace test-results/cart-spec-ts-add-to-cart/trace.zip
What Traces Contain
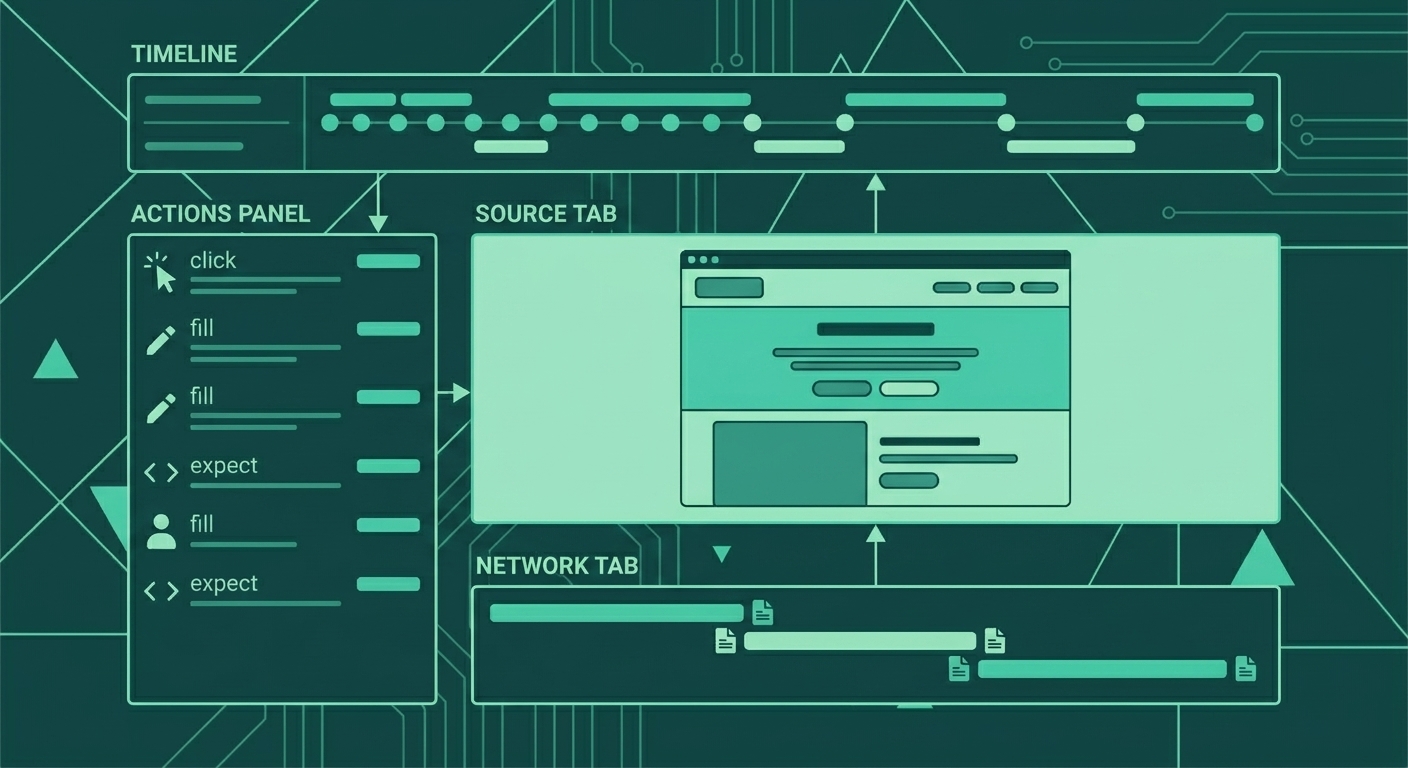
The Trace Viewer includes four main sections:
- Timeline: Screenshots and DOM snapshots at each action, network requests, console logs
- Actions Panel: Each Playwright action with timing, locator used, success/failure status
- Source Tab: Your test code with the current line highlighted
- Network Tab: All HTTP requests, request/response bodies, timing waterfall
Debugging with Trace Viewer
Scenario: Test fails with "Element not visible"- Open trace in Trace Viewer
- Find the failing action in the timeline
- Click to see the screenshot at that moment
- Check the DOM snapshot - is the element there?
- Check Network tab - did the API call complete?
- Look at the action before - did something unexpected happen?
UI Mode
UI Mode is an interactive development environment for tests.
Starting UI Mode
npx playwright test --uiUI Mode Features
Watch mode:- Tests re-run automatically when you save files
- Instant feedback on changes
- Click any action to see the page at that moment
- Scrub through the timeline like a video
- Run specific test files
- Filter by test name
- Show only failed tests
- Hover over actions to see which element was targeted
- Try locators in the browser in real-time
UI Mode Workflow
// Write test with UI mode open
test('add to cart shows success message', async ({ page }) => {
  await page.goto('/products/laptop');

  // Run just this test in UI mode
  // Watch it execute, see the browser

  await page.getByRole('button', { name: 'Add to Cart' }).click();

  // See if the message appears
  await expect(page.getByText('Added to cart')).toBeVisible();
});
Debugging Flaky Tests
Flaky tests pass sometimes, fail sometimes. They're the worst. Here's how to fix them.
Step 1: Gather Data
// playwright.config.ts
export default defineConfig({
  use: {
    trace: 'on',  // Always record traces
  },
  retries: 3,  // Multiple runs to catch flakiness
});
Step 2: Compare Passing vs Failing Traces
Open both traces side by side. Look for:
- Timing differences: Slower network? Longer animations?
- Different DOM state: Was element in different position?
- Network failures: API returned error?
- Race conditions: Actions happened in unexpected order?
Step 3: Common Flaky Test Patterns
Pattern 1: Element not stable// FLAKY: Element might be animating
await page.locator('.notification').click();
// FIXED: Wait for animation to complete
await page.locator('.notification').waitFor({ state: 'visible' });
await expect(page.locator('.notification')).toBeVisible();
await page.locator('.notification').click();// FLAKY: Checking cart before update completes
await page.getByRole('button', { name: 'Add to Cart' }).click();
const count = await page.locator('.cart-count').textContent();
// FIXED: Web-first assertion
await page.getByRole('button', { name: 'Add to Cart' }).click();
await expect(page.locator('.cart-count')).toHaveText('1');// FLAKY: Page might not have navigated yet
await page.getByRole('link', { name: 'Checkout' }).click();
await expect(page.getByText('Checkout')).toBeVisible();
// FIXED: Wait for navigation
await page.getByRole('link', { name: 'Checkout' }).click();
await page.waitForURL('**/checkout');
await expect(page.getByText('Checkout')).toBeVisible();// FLAKY: Cookie banner might block the button
await page.getByRole('button', { name: 'Add to Cart' }).click();
// FIXED: Handle overlay first
test.beforeEach(async ({ page }) => {
await page.goto('/');
// Dismiss cookie banner if present
const cookieBanner = page.getByRole('button', { name: 'Accept Cookies' });
if (await cookieBanner.isVisible({ timeout: 1000 }).catch(() => false)) {
await cookieBanner.click();
}
});Step 4: Add Diagnostic Information
test('checkout completes', async ({ page }) => {
  await page.goto('/checkout');

  // Add console logs that appear in trace
  console.log('Starting checkout test');

  await page.getByLabel('Email').fill('test@example.com');
  console.log('Filled email');

  // Check network state
  const cookies = await page.context().cookies();
  console.log('Session cookie:', cookies.find(c => c.name === 'session'));

  await page.getByRole('button', { name: 'Continue' }).click();

  // If this fails, trace will show all the logs
  await expect(page.getByText('Order confirmed')).toBeVisible();
});
Debugging E-Commerce Scenarios
Payment Flow Debugging
test('payment completes successfully', async ({ page }) => {
  await page.goto('/checkout');

  // Enable request logging
  page.on('request', request => {
    if (request.url().includes('/api/payment')) {
      console.log('Payment request:', request.postData());
    }
  });

  page.on('response', response => {
    if (response.url().includes('/api/payment')) {
      console.log('Payment response:', response.status());
    }
  });

  await page.getByLabel('Card number').fill('4111111111111111');
  await page.getByLabel('Expiry').fill('12/25');
  await page.getByLabel('CVV').fill('123');

  await page.getByRole('button', { name: 'Pay' }).click();

  // Trace will show the network calls
  await expect(page.getByText('Payment successful')).toBeVisible();
});
Cart State Debugging
test('cart persists across pages', async ({ page, context }) => {
  // Log storage state
  test.afterEach(async () => {
    const storage = await context.storageState();
    console.log('localStorage:', storage.origins[0]?.localStorage);
    console.log('Cookies:', storage.cookies);
  });

  await page.goto('/products/laptop');
  await page.getByRole('button', { name: 'Add to Cart' }).click();

  await page.goto('/products/mouse');

  // If this fails, storage log shows cart state
  await expect(page.getByTestId('cart-count')).toHaveText('1');
});
CI Debugging Workflow
GitHub Actions: Artifact Collection
# .github/workflows/test.yml
- name: Run tests
  run: npx playwright test

- name: Upload traces on failure
  if: failure()
  uses: actions/upload-artifact@v4
  with:
    name: playwright-traces
    path: test-results/
    retention-days: 7

- name: Upload report
  if: always()
  uses: actions/upload-artifact@v4
  with:
    name: playwright-report
    path: playwright-report/
Downloading and Viewing CI Traces
# Download artifact from GitHub Actions
# Extract to local directory

# View traces
npx playwright show-trace test-results/*/trace.zip

# Or open the full report
npx playwright show-report playwright-report
Remote Debugging
// Connect to a running browser (for debugging live issues)
const browser = await chromium.connectOverCDP('http://localhost:9222');
const context = browser.contexts()[0];
const page = context.pages()[0];

// Now you can interact with an existing browser session
await page.screenshot({ path: 'debug.png' });
Key Takeaways
- Playwright Inspector (
--debug) for step-through debugging - page.pause() adds breakpoints in test code
- Trace Viewer shows screenshots, DOM, network at every step
- UI Mode (
--ui) for interactive development with time-travel - Flaky tests leave clues in trace differences
- Always enable traces in CI for post-mortem debugging
- Upload traces as artifacts for failed CI runs
Next Lesson
You can debug any test failure now. But as your suite grows to hundreds of tests, running them becomes slow. In the next lesson, we'll learn CI/CD and parallel execution to run tests fast at scale.