Results Analysis & Bottlenecks
Running a load test is easy. Understanding the results is where real performance engineering happens.
This lesson teaches you to read JMeter results like a detective - finding the performance problems hiding in the numbers.
Key Performance Metrics
The Big Four
| Metric | What It Measures | Good vs Bad |
|---|---|---|
| Response Time | How long requests take | Lower is better |
| Throughput | Requests processed per second | Higher is better |
| Error Rate | Percentage of failed requests | Lower is better (< 1%) |
| Concurrent Users | Active users at any moment | Depends on your goals |
Response Time Breakdown
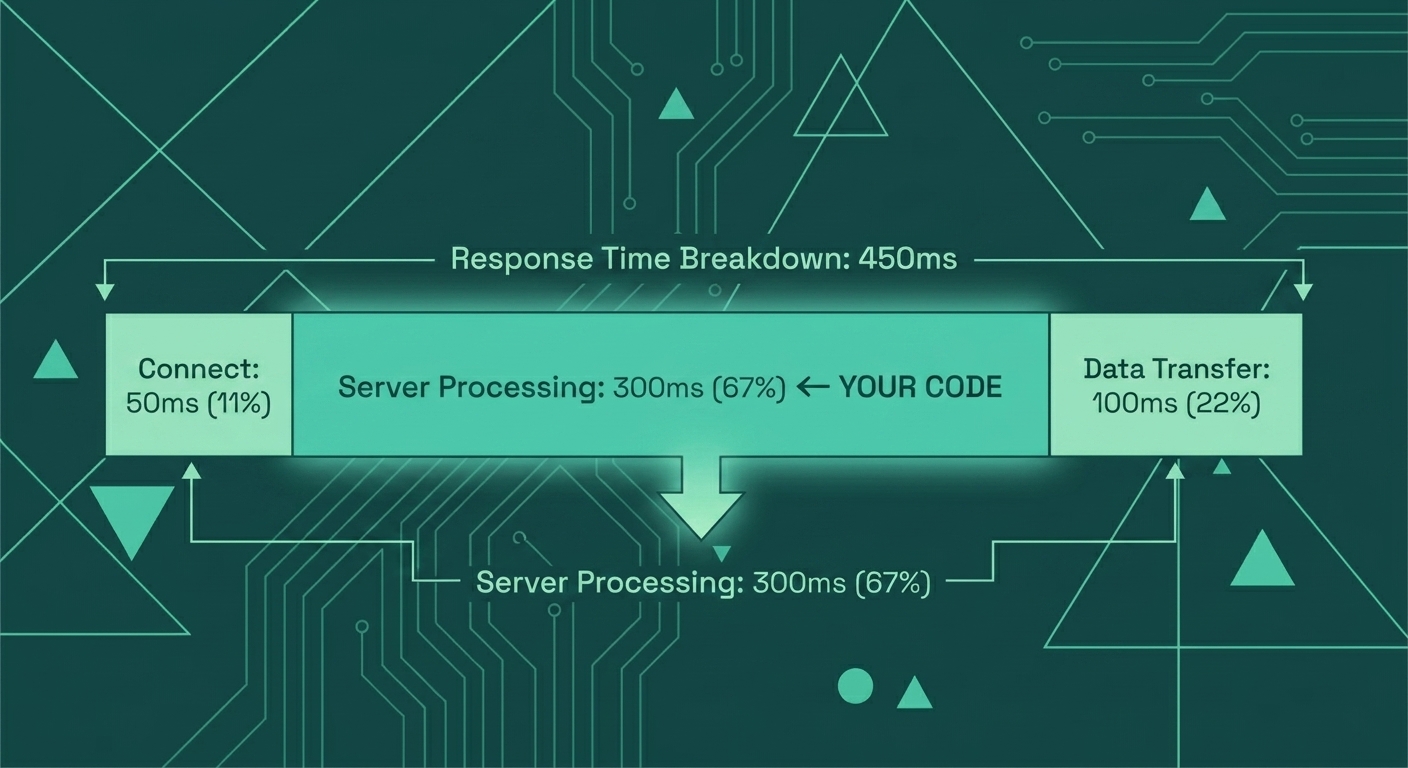
Total Response Time = Network Connect + Server Processing + Data Transfer. The Server Processing portion is the part your code controls - this is where optimization efforts should focus.
In JMeter, look at:
- Latency: Time until first byte received (network + server start processing)
- Connect Time: TCP connection establishment
- Response Time: Total from request sent to response complete
Why Averages Lie
Consider this test result:
1000 requests total:
- 950 requests: 100ms
- 50 requests: 5000ms

Average: (950 * 100 + 50 * 5000) / 1000 = 345ms
345ms average sounds acceptable. But 5% of your users waited 5 seconds. On a site with 10,000 daily users, that's 500 frustrated people.
Always look at percentiles.Understanding Percentiles
Real Example
Response times for "Get Product" (1000 samples):

P50 (Median):  85ms   ← Half your users see this or better
P90:           145ms  ← 90% see this or better
P95:           280ms  ← 95% see this or better
P99:           1250ms ← 99% see this or better
Max:           4500ms ← Your worst case

Average: 165ms ← Hides the P99 problem!JMeter Listeners for Analysis
Summary Report
Quick overview of all samplers:
| Label | Samples | Average | Min | Max | Std Dev | Error% | Throughput |
|---|---|---|---|---|---|---|---|
| Get Products | 5000 | 145 | 45 | 2340 | 189 | 0.2% | 85.3/sec |
| Add to Cart | 3000 | 234 | 78 | 4500 | 412 | 1.5% | 51.2/sec |
| Checkout | 1000 | 890 | 320 | 8900 | 756 | 3.2% | 17.1/sec |
- Add to Cart: High Std Dev (412) indicates inconsistent performance
- Checkout: 3.2% error rate is too high, and Max of 8900ms is problematic
Aggregate Report
Includes percentile data:
| Label | P90 | P95 | P99 | Throughput | KB/sec |
|---|---|---|---|---|---|
| Get Products | 180 | 245 | 890 | 85.3/sec | 1024.5 |
| Add to Cart | 340 | 580 | 2100 | 51.2/sec | 156.8 |
| Checkout | 1200 | 2400 | 6500 | 17.1/sec | 89.2 |
Identifying Bottlenecks
Pattern 1: Throughput Plateau
Time     Threads   Throughput   Avg Response
0:00     50        100/sec      150ms
0:05     100       195/sec      160ms
0:10     150       280/sec      180ms
0:15     200       295/sec      340ms    ← Plateau starts
0:20     250       300/sec      580ms    ← Throughput stuck
0:25     300       298/sec      890ms    ← Response time climbing
0:30 350 295/sec 1200ms ← Queue building up- CPU saturation on application server
- Database connection pool exhaustion
- Network bandwidth limit
- Thread pool size limit
Pattern 2: Error Spike at Threshold
Time     Threads   Throughput   Error Rate
0:00     50        100/sec      0.1%
0:05     100       198/sec      0.2%
0:10     150       290/sec      0.3%
0:15     200       310/sec      0.5%
0:20     250       315/sec      5.2%     ← Sudden spike!
0:25 300 280/sec 12.8% ← Cascading failuresPattern 3: Gradual Degradation (Soak Test)
Hour     Throughput   P95 Response   Memory (App Server)
1        500/sec      200ms          2.1 GB
2        498/sec      210ms          2.4 GB
4        495/sec      240ms          3.1 GB
6        480/sec      320ms          3.8 GB
8 450/sec 580ms 4.5 GB ← Memory leak!Database Bottleneck Indicators
Connection Pool Exhaustion
JMeter error:
Error: Unable to acquire connection from pool
Error: Connection pool exhausted (max: 50)
Application logs:
WARN  HikariPool - Connection pool is at 100% capacity
ERROR HikariPool - Connection not available, waited 30000ms- Increase pool size (temporary fix)
- Optimize slow queries (real fix)
- Add connection timeouts
- Check for connection leaks
Slow Query Indicators
Request              Avg Response   P99 Response
Get Products         150ms          350ms        ← Fast
Get Product Detail   180ms          400ms        ← Fast
Search Products      850ms          3500ms       ← SLOW
Get Order History 1200ms 5500ms ← SLOW- Check database slow query log
- Add missing indexes
- Optimize or cache expensive queries
Lock Contention
Symptom: Response times increase dramatically under load, but CPU is not maxed.
Time     Threads   CPU%   Throughput   Avg Response
0:00     50        25%    100/sec      150ms
0:10     100       35%    180/sec      220ms
0:20     150       40%    200/sec      450ms      ← CPU not the limit
0:30 200 42% 195/sec 780ms ← Throughput droppingReading JMeter Results Files
Generate HTML Report
jmeter -g results.jtl -o report-folder/This creates a comprehensive HTML report with:
- Dashboard overview
- Response time graphs
- Throughput over time
- Error analysis
- Top 5 errors by sampler
Key Report Sections
APDEX (Application Performance Index):- Score 0-1 (1 is perfect)
- Based on satisfied/tolerating/frustrated thresholds
- Quick pass/fail indicator
- Graph showing P50, P90, P95, P99 over time
- Look for spikes correlating with thread increases
- Should increase with threads until plateau
- Drops indicate problems
Bottleneck Checklist
- Application Server: CPU, memory, thread pools
- Database: Connection pool, slow queries, lock waits
- Network: Bandwidth, latency, connection limits
- External Services: Payment gateway, CDN, third-party APIs
- Load Balancer: Connection limits, health check failures
- JMeter Itself: Running in GUI mode? Too many listeners?
Common Mistakes in Analysis
First few minutes show JIT compilation, cache warming, connection pool filling. Exclude initial ramp-up from analysis. Look at steady-state results.
Staging has 1 server, production has 10. Results don't scale linearly. Test against production-like infrastructure or understand the differences.
Error responses are often faster than successful ones (less processing). High error rates can make average times look good while the system is failing.
Key Takeaways
- Use percentiles, not averages: P95 and P99 reveal what your worst-affected users experience.
- Throughput plateau = bottleneck: When throughput stops increasing despite more threads, you've hit a limit.
- Correlate metrics: Response time + throughput + error rate together tell the real story.
- Check the database first: Connection pools and slow queries cause most e-commerce performance issues.
Next Lesson
You can analyze results. Now let's scale up: Distributed Testing and CI/CD - running tests from multiple machines, integrating with Jenkins and GitHub Actions, and avoiding common production testing mistakes.