JMeter Fundamentals
Apache JMeter is a powerful, open-source tool for performance testing. In this lesson, you'll understand how JMeter works and create your first test.
Installing JMeter
Prerequisites
JMeter requires Java 8 or higher:
# Check Java version
java -version

# Should show Java 8+ (1.8 or higher)
Download and Install
# Download JMeter (check apache.org for latest version)
wget https://downloads.apache.org/jmeter/binaries/apache-jmeter-5.6.3.zip

# Extract
unzip apache-jmeter-5.6.3.zip

# Run JMeter GUI
cd apache-jmeter-5.6.3/bin
./jmeter.sh  # Linux/Mac
jmeter.bat   # Windows
For larger tests, increase JMeter's heap size by editing jmeter.bat or jmeter.sh:
HEAP="-Xms1g -Xmx4g"
JMeter Architecture
Understanding JMeter's components is essential:
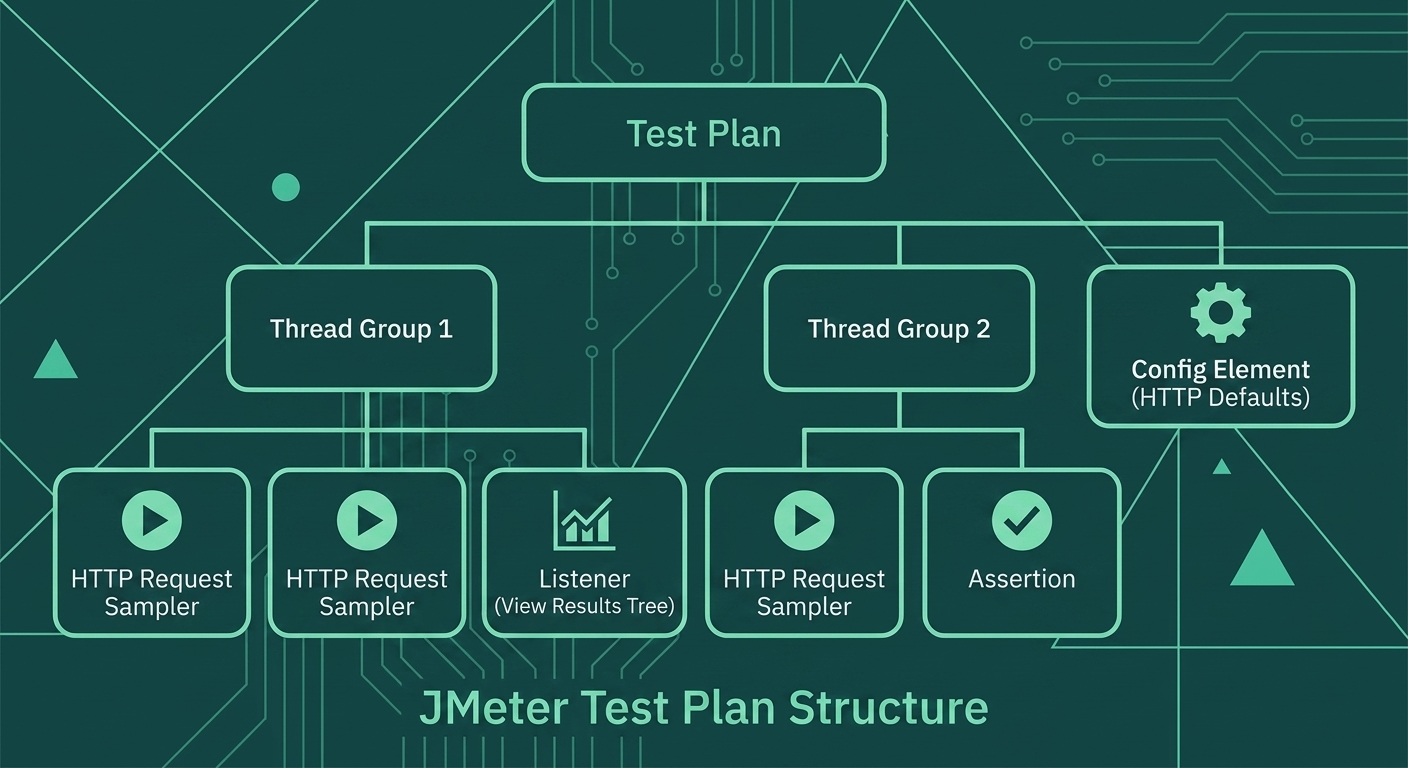
The Test Plan contains Thread Groups (virtual users), which contain Samplers (requests), Timers (think time), and Assertions (validation). Config Elements and Listeners can be added at various levels.
Core Components
Test Plan
The container for your entire test. Everything else goes inside the Test Plan.
<?xml version="1.0" encoding="UTF-8"?>
<jmeterTestPlan version="1.2">
  <hashTree>
    <TestPlan guiclass="TestPlanGui" testclass="TestPlan" testname="E-Commerce Load Test">
      <boolProp name="TestPlan.functional_mode">false</boolProp>
      <stringProp name="TestPlan.comments">Product catalog performance test</stringProp>
    </TestPlan>
    <hashTree>
      <!-- Thread Groups, Samplers, etc. go here -->
    </hashTree>
  </hashTree>
</jmeterTestPlan>
Thread Group
Defines how many virtual users (threads) will run and how they behave.
| Property | Description | Example |
|---|---|---|
| Number of Threads | Virtual users | 100 |
| Ramp-up Period | Time to start all threads | 60 seconds |
| Loop Count | Iterations per thread | 10 |
<ThreadGroup guiclass="ThreadGroupGui" testclass="ThreadGroup" testname="Shoppers">
  <stringProp name="ThreadGroup.num_threads">100</stringProp>
  <stringProp name="ThreadGroup.ramp_time">60</stringProp>
  <intProp name="ThreadGroup.num_threads">10</intProp>
  <boolProp name="ThreadGroup.scheduler">false</boolProp>
</ThreadGroup>
Samplers
Samplers send requests to your server. The most common is the HTTP Request Sampler.
<HTTPSamplerProxy guiclass="HttpTestSampleGui" testclass="HTTPSamplerProxy" testname="Get Product List">
  <stringProp name="HTTPSampler.domain">api.mystore.com</stringProp>
  <stringProp name="HTTPSampler.port">443</stringProp>
  <stringProp name="HTTPSampler.protocol">https</stringProp>
  <stringProp name="HTTPSampler.path">/api/products</stringProp>
  <stringProp name="HTTPSampler.method">GET</stringProp>
</HTTPSamplerProxy>
Listeners
Listeners collect and display test results. Common listeners:
View Results Tree
Debug individual requests and responses
Summary Report
Aggregate statistics per request
Aggregate Report
Detailed percentile data (P90, P95, P99)
Graph Results
Visual response time over time
NEVER use graphical listeners during real load tests! They consume massive memory and CPU, skewing your results. Use them only for debugging with a few threads. For actual tests, run in CLI mode and write results to files.
Timers
Timers add delays between requests to simulate realistic user behavior (think time).
<ConstantTimer guiclass="ConstantTimerGui" testclass="ConstantTimer" testname="Think Time">
  <stringProp name="ConstantTimer.delay">3000</stringProp>
</ConstantTimer>
Assertions
Assertions validate responses. A passed assertion means the request worked correctly.
<ResponseAssertion guiclass="AssertionGui" testclass="ResponseAssertion" testname="Check Success">
  <stringProp name="Assertion.test_field">Assertion.response_code</stringProp>
  <stringProp name="Assertion.test_type">2</stringProp>
  <stringProp name="Assertion.test_strings">200</stringProp>
</ResponseAssertion>
JMeter GUI Tour
When you open JMeter, you'll see the interface layout:
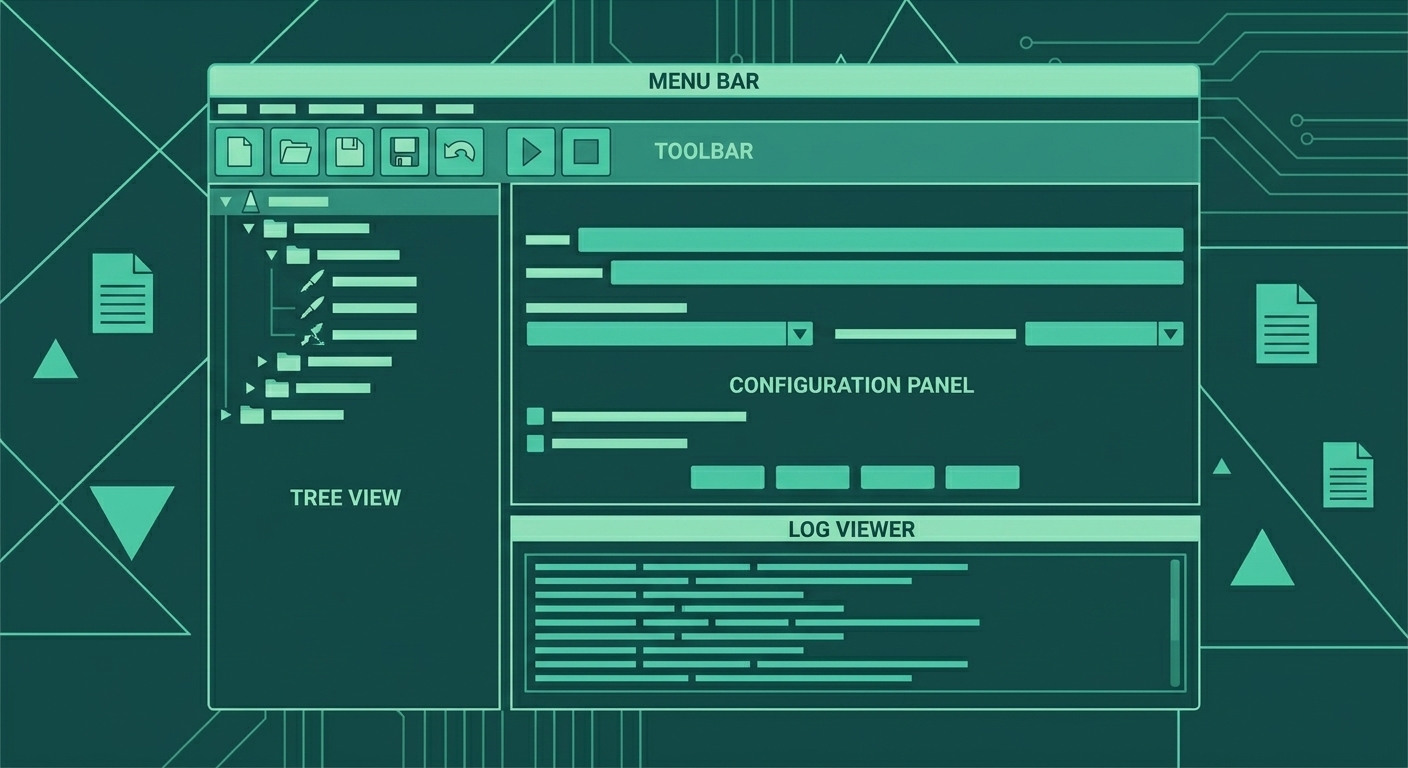
The interface includes: Menu Bar (File, Edit, Run, etc.), Toolbar (New, Open, Save, Start, Stop), Tree View (test plan hierarchy), Configuration Panel (settings for selected element), and Log Viewer (errors and warnings).
Adding Elements: Right-click on any tree item to add child elements.Your First Test: Product API
Let's create a simple test against an e-commerce product API.
Step 1: Add Thread Group
Right-click Test Plan → Add → Threads (Users) → Thread Group
Configure:
- Name: Product Browsers
- Number of Threads: 10
- Ramp-up Period: 10 seconds
- Loop Count: 5
Step 2: Add HTTP Request
Right-click Thread Group → Add → Sampler → HTTP Request
Configure:
- Name: Get Products
- Protocol: https
- Server Name: fakestoreapi.com
- Path: /products
- Method: GET
Step 3: Add Listener
Right-click Thread Group → Add → Listener → View Results Tree
Step 4: Run the Test
Click the green Start button (or press Ctrl+R).
Understanding Results
In the View Results Tree, click on a request:
Request:
GET https://fakestoreapi.com/products

Response Headers:
HTTP/1.1 200 OK
Content-Type: application/json

Response Body:
[
  {"id": 1, "title": "Fjallraven Backpack", "price": 109.95, ...},
  {"id": 2, "title": "Mens Casual T-Shirt", "price": 22.30, ...},
  ...
]

Response Time: 245 ms
Complete Test Plan XML
Here's the complete test plan in JMeter's XML format:
<?xml version="1.0" encoding="UTF-8"?>
<jmeterTestPlan version="1.2">
  <hashTree>
    <TestPlan guiclass="TestPlanGui" testclass="TestPlan" testname="Product API Test">
      <boolProp name="TestPlan.functional_mode">false</boolProp>
      <boolProp name="TestPlan.serialize_threadgroups">false</boolProp>
    </TestPlan>
    <hashTree>
      <ThreadGroup guiclass="ThreadGroupGui" testclass="ThreadGroup" testname="Product Browsers">
        <stringProp name="ThreadGroup.num_threads">10</stringProp>
        <stringProp name="ThreadGroup.ramp_time">10</stringProp>
        <elementProp name="ThreadGroup.main_controller" elementType="LoopController">
          <boolProp name="LoopController.continue_forever">false</boolProp>
          <stringProp name="LoopController.loops">5</stringProp>
        </elementProp>
      </ThreadGroup>
      <hashTree>
        <HTTPSamplerProxy guiclass="HttpTestSampleGui" testclass="HTTPSamplerProxy" testname="Get Products">
          <stringProp name="HTTPSampler.domain">fakestoreapi.com</stringProp>
          <stringProp name="HTTPSampler.port"></stringProp>
          <stringProp name="HTTPSampler.protocol">https</stringProp>
          <stringProp name="HTTPSampler.path">/products</stringProp>
          <stringProp name="HTTPSampler.method">GET</stringProp>
          <boolProp name="HTTPSampler.follow_redirects">true</boolProp>
          <boolProp name="HTTPSampler.use_keepalive">true</boolProp>
        </HTTPSamplerProxy>
        <hashTree>
          <ResponseAssertion guiclass="AssertionGui" testclass="ResponseAssertion" testname="Check 200 OK">
            <collectionProp name="Asserion.test_strings">
              <stringProp name="49586">200</stringProp>
            </collectionProp>
            <stringProp name="Assertion.test_field">Assertion.response_code</stringProp>
            <intProp name="Assertion.test_type">2</intProp>
          </ResponseAssertion>
        </hashTree>
        <ResultCollector guiclass="ViewResultsFullVisualizer" testclass="ResultCollector" testname="View Results Tree">
          <boolProp name="ResultCollector.error_logging">false</boolProp>
        </ResultCollector>
      </hashTree>
    </hashTree>
  </hashTree>
</jmeterTestPlan>
Test Execution Modes
GUI Mode (Development Only)
./jmeter.shUse for:
- Building test plans
- Debugging with small thread counts
- Learning and exploration
CLI Mode (Production Tests)
./jmeter.sh -n -t test_plan.jmx -l results.jtl -e -o report_folder| Flag | Meaning |
|---|---|
-n | Non-GUI mode |
-t | Test plan file |
-l | Results log file |
-e | Generate report after test |
-o | Report output folder |
Always run actual performance tests in CLI mode. GUI mode is only for building and debugging tests with minimal load.
Key Takeaways
- Thread = Virtual User: Each thread simulates one user making requests.
- Test Plan hierarchy: Test Plan → Thread Group → Samplers → Assertions/Timers.
- Listeners for debugging only: Never use graphical listeners in real load tests.
- CLI for production: Run actual performance tests in non-GUI mode with
-nflag.
Next Lesson
You've created your first test! Next, we'll dive deep into Thread Groups and Realistic Load - configuring virtual users, ramp-up periods, and think times to simulate real user behavior.