Distributed Testing & CI/CD
You've built comprehensive test plans. Now it's time to run them at scale - generating thousands of concurrent users from multiple machines and integrating performance tests into your deployment pipeline.
CLI Mode: The Only Way to Run Real Tests
NEVER run actual load tests in GUI mode. GUI mode is for building and debugging only. Always use CLI mode (-n flag) for real tests.
Why CLI Mode?
| Aspect | GUI Mode | CLI Mode |
|---|---|---|
| Resource usage | High (rendering graphs) | Minimal |
| Max threads | ~500 (on good hardware) | 2000+ |
| Result accuracy | Skewed by UI overhead | Accurate |
| CI/CD compatible | No | Yes |
| Remote execution | Difficult | Easy |
Basic CLI Execution
# Basic test execution
jmeter -n -t ecommerce-test.jmx -l results.jtl

# With HTML report generation
jmeter -n -t ecommerce-test.jmx -l results.jtl -e -o report-folder/

# With properties override
jmeter -n -t ecommerce-test.jmx -l results.jtl \
  -JTHREADS=500 \
  -JRAMPUP=60 \
  -JDURATION=600 \
  -JBASE_URL=https://staging.mystore.com
CLI Flags Reference
| Flag | Purpose | Example |
|---|---|---|
-n | Non-GUI mode | Required for CLI |
-t | Test plan file | -t test.jmx |
-l | Results log file | -l results.jtl |
-e | Generate report after test | Use with -o |
-o | Report output directory | -o ./report |
-J | Set JMeter property | -JTHREADS=100 |
-G | Set global property (distributed) | -Gprop=value |
-r | Run distributed test | Triggers all slaves |
-R | Specify slave hosts | -R host1,host2 |
Parameterized Test Plans
Use properties to make tests configurable:
<!-- In your test plan, use __P function -->
<ThreadGroup testname="Load Test">
  <stringProp name="ThreadGroup.num_threads">${__P(THREADS,100)}</stringProp>
  <stringProp name="ThreadGroup.ramp_time">${__P(RAMPUP,60)}</stringProp>
  <boolProp name="ThreadGroup.scheduler">true</boolProp>
  <stringProp name="ThreadGroup.duration">${__P(DURATION,300)}</stringProp>
</ThreadGroup>

<ConfigTestElement testname="HTTP Request Defaults">
  <stringProp name="HTTPSampler.domain">${__P(BASE_URL,api.mystore.com)}</stringProp>
</ConfigTestElement>
Run with different configurations:
# Smoke test
jmeter -n -t test.jmx -JTHREADS=10 -JDURATION=60

# Load test
jmeter -n -t test.jmx -JTHREADS=500 -JDURATION=1800

# Stress test
jmeter -n -t test.jmx -JTHREADS=2000 -JDURATION=3600
Distributed Testing Architecture
When one machine can't generate enough load, distribute across multiple.
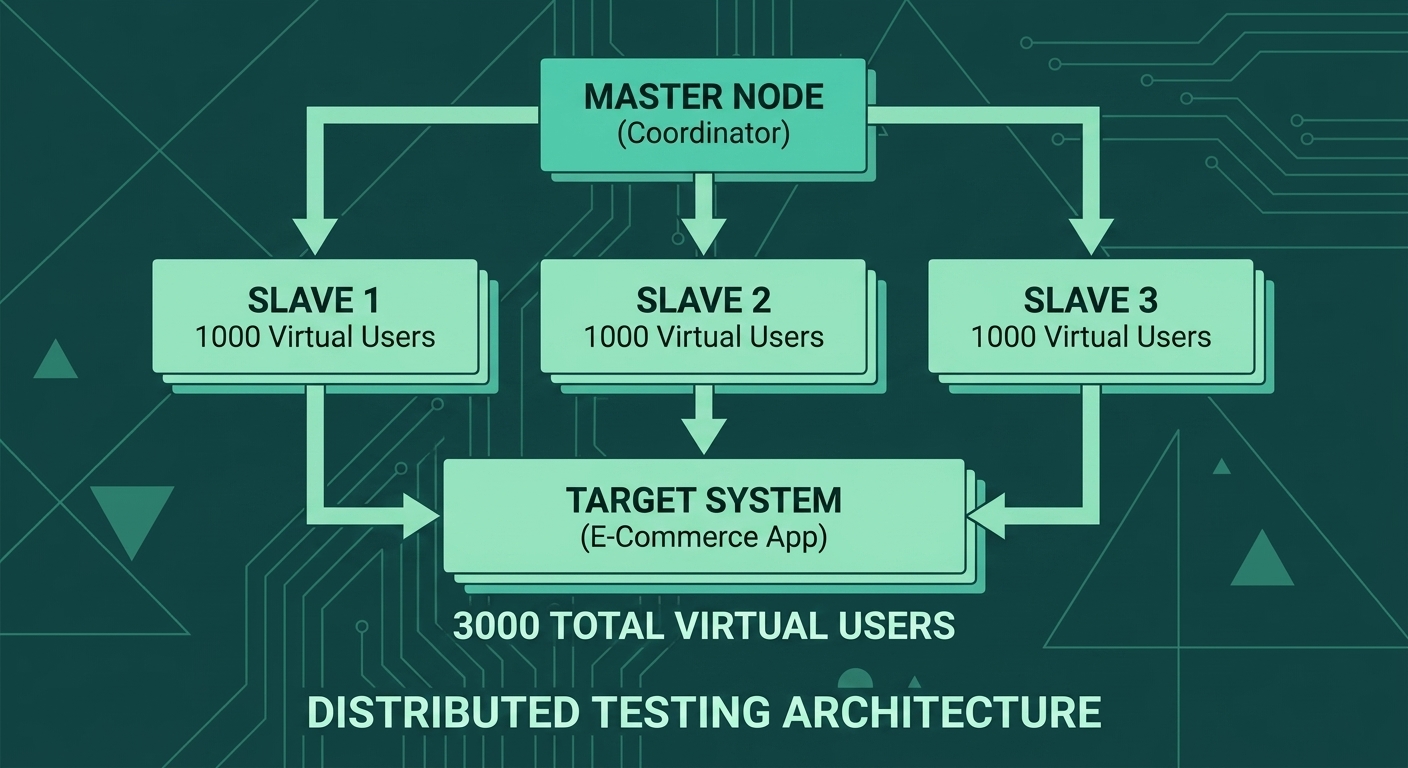
The Master Node coordinates the test, sending instructions to multiple Slave Nodes that generate the actual load. All slaves target the same system, allowing you to simulate thousands of concurrent users from multiple machines.
Setting Up Distributed Testing
On Each Slave Node:# Start JMeter in server mode
cd apache-jmeter-5.6.3/bin
./jmeter-server
# Or specify the RMI hostname (for cloud instances)
./jmeter-server -Djava.rmi.server.hostname=<slave-public-ip>Edit jmeter.properties:
# List all slave hosts
remote_hosts=slave1.example.com,slave2.example.com,slave3.example.com

# Or use IP addresses
remote_hosts=10.0.1.10,10.0.1.11,10.0.1.12# Run on all configured slaves
jmeter -n -t test.jmx -r -l results.jtl
# Run on specific slaves only
jmeter -n -t test.jmx -R slave1.example.com,slave2.example.com -l results.jtlDistributed Test Configuration
<!-- Thread count is PER SLAVE -->
<ThreadGroup testname="Distributed Load">
  <!-- 500 threads x 3 slaves = 1500 total virtual users -->
  <stringProp name="ThreadGroup.num_threads">500</stringProp>
  <stringProp name="ThreadGroup.ramp_time">60</stringProp>
</ThreadGroup>
Data File Distribution
Slave nodes need access to CSV files. Options:
Option 1: Copy files to all slavesscp test-data/*.csv slave1:/opt/jmeter/test-data/
scp test-data/*.csv slave2:/opt/jmeter/test-data/slave1 uses: users_001-333.csv
slave2 uses: users_334-666.csv
slave3 uses: users_667-1000.csv# Point all slaves to shared location
user_data_file=/mnt/shared/test-data/users.csvJenkins Integration
Jenkins Pipeline
pipeline {
    agent any

    parameters {
        string(name: 'THREADS', defaultValue: '100', description: 'Number of threads')
        string(name: 'DURATION', defaultValue: '300', description: 'Test duration in seconds')
        string(name: 'TARGET_URL', defaultValue: 'https://staging.mystore.com', description: 'Target URL')
    }

    environment {
        JMETER_HOME = '/opt/apache-jmeter-5.6.3'
    }

    stages {
        stage('Prepare') {
            steps {
                // Clean previous results
                sh 'rm -rf results/ report/'
                sh 'mkdir -p results report'
            }
        }

        stage('Run Performance Test') {
            steps {
                sh """
                    ${JMETER_HOME}/bin/jmeter -n \
                        -t tests/ecommerce-load-test.jmx \
                        -l results/results.jtl \
                        -JTHREADS=${params.THREADS} \
                        -JDURATION=${params.DURATION} \
                        -JBASE_URL=${params.TARGET_URL} \
                        -e -o report/
                """
            }
        }

        stage('Analyze Results') {
            steps {
                script {
                    // Parse results and check thresholds
                    def results = readFile('results/results.jtl')
                    def lines = results.split('\n')

                    // Simple error rate calculation
                    def total = 0
                    def errors = 0
                    lines.each { line ->
                        if (line.contains(',')) {
                            total++
                            if (line.contains(',false,')) {
                                errors++
                            }
                        }
                    }

                    def errorRate = (errors / total) * 100
                    echo "Error Rate: ${errorRate}%"

                    if (errorRate > 1.0) {
                        error("Error rate ${errorRate}% exceeds threshold of 1%")
                    }
                }
            }
        }

        stage('Publish Report') {
            steps {
                publishHTML([
                    allowMissing: false,
                    alwaysLinkToLastBuild: true,
                    keepAll: true,
                    reportDir: 'report',
                    reportFiles: 'index.html',
                    reportName: 'JMeter Performance Report'
                ])
            }
        }
    }

    post {
        always {
            archiveArtifacts artifacts: 'results/*.jtl', fingerprint: true
        }
        failure {
            slackSend(
                color: 'danger',
                message: "Performance test failed: ${env.JOB_NAME} #${env.BUILD_NUMBER}"
            )
        }
    }
}
Jenkins Performance Plugin
Use the Performance Plugin for built-in analysis:
stage('Analyze with Performance Plugin') {
    steps {
        perfReport(
            sourceDataFiles: 'results/results.jtl',
            errorFailedThreshold: 1,
            errorUnstableThreshold: 0.5,
            relativeFailedThresholdPositive: 20,
            relativeUnstableThresholdPositive: 10
        )
    }
}
GitHub Actions Integration
Performance Test Workflow
name: Performance Tests

on:
  push:
    branches: [main]
  pull_request:
    branches: [main]
  schedule:
    # Run nightly at 2 AM
    - cron: '0 2 * * *'

jobs:
  performance-test:
    runs-on: ubuntu-latest

    env:
      JMETER_VERSION: 5.6.3

    steps:
      - name: Checkout code
        uses: actions/checkout@v4

      - name: Set up Java
        uses: actions/setup-java@v4
        with:
          distribution: 'temurin'
          java-version: '17'

      - name: Cache JMeter
        uses: actions/cache@v4
        with:
          path: ~/jmeter
          key: jmeter-${{ env.JMETER_VERSION }}

      - name: Install JMeter
        run: |
          if [ ! -d ~/jmeter ]; then
            wget -q https://archive.apache.org/dist/jmeter/binaries/apache-jmeter-${JMETER_VERSION}.tgz
            tar -xzf apache-jmeter-${JMETER_VERSION}.tgz
            mv apache-jmeter-${JMETER_VERSION} ~/jmeter
          fi
          echo "$HOME/jmeter/bin" >> $GITHUB_PATH

      - name: Run Smoke Test
        run: |
          jmeter -n \
            -t tests/ecommerce-load-test.jmx \
            -l results.jtl \
            -JTHREADS=10 \
            -JDURATION=60 \
            -JBASE_URL=${{ secrets.STAGING_URL }} \
            -e -o report/

      - name: Check Results
        run: |
          # Calculate error rate
          TOTAL=$(wc -l < results.jtl)
          ERRORS=$(grep -c ",false," results.jtl || true)
          ERROR_RATE=$(echo "scale=2; $ERRORS / $TOTAL * 100" | bc)

          echo "Total requests: $TOTAL"
          echo "Failed requests: $ERRORS"
          echo "Error rate: $ERROR_RATE%"

          # Fail if error rate > 1%
          if (( $(echo "$ERROR_RATE > 1" | bc -l) )); then
            echo "Error rate too high!"
            exit 1
          fi

      - name: Upload Report
        uses: actions/upload-artifact@v4
        if: always()
        with:
          name: jmeter-report
          path: report/

      - name: Upload Results
        uses: actions/upload-artifact@v4
        if: always()
        with:
          name: jmeter-results
          path: results.jtl
PR Comment with Results
      - name: Comment PR with Results
        if: github.event_name == 'pull_request'
        uses: actions/github-script@v7
        with:
          script: |
            const fs = require('fs');
            const results = fs.readFileSync('results.jtl', 'utf8');
            const lines = results.trim().split('\n');

            let total = 0, errors = 0, totalTime = 0;
            lines.forEach(line => {
              const parts = line.split(',');
              if (parts.length > 1) {
                total++;
                totalTime += parseInt(parts[1]) || 0;
                if (parts[7] === 'false') errors++;
              }
            });

            const avgTime = Math.round(totalTime / total);
            const errorRate = ((errors / total) * 100).toFixed(2);

            const body = `## Performance Test Results

            | Metric | Value |
            |--------|-------|
            | Total Requests | ${total} |
            | Error Rate | ${errorRate}% |
            | Avg Response Time | ${avgTime}ms |

            [View Full Report](${process.env.GITHUB_SERVER_URL}/${process.env.GITHUB_REPOSITORY}/actions/runs/${process.env.GITHUB_RUN_ID})`;

            github.rest.issues.createComment({
              owner: context.repo.owner,
              repo: context.repo.repo,
              issue_number: context.issue.number,
              body: body
            });
Common Mistakes to Avoid
View Results Tree and other GUI listeners consume memory even in CLI mode. Disable or remove them before running large tests. Use -l results.jtl to capture results instead.
Default JMeter heap is often too small for large tests. Edit jmeter script to increase: HEAP="-Xms2g -Xmx4g"
Testing from the same data center skips internet latency. Use geographically distributed load generators for realistic results, or account for the difference.
JMeter results only tell you what clients experienced. Monitor server CPU, memory, database, and logs during tests to understand WHY performance degraded.
Production Test Checklist
Before running performance tests:
- [ ] Test plan uses CLI-compatible configuration (no GUI listeners)
- [ ] Data files are accessible to all load generators
- [ ] Properties are parameterized for different environments
- [ ] Heap memory is configured appropriately
- [ ] Server monitoring is active (APM, logs, metrics)
- [ ] Stakeholders are notified (tests may impact shared resources)
- [ ] Rollback plan exists if tests cause problems
- [ ] Results directory is clean / has unique naming
Key Takeaways
- CLI mode only: Never run real load tests in GUI mode. Use
-nflag always. - Distributed for scale: One machine caps around 2000 threads. Use master-slave for more.
- CI/CD integration: Automate performance tests in pipelines to catch regressions early.
- Monitor everything: JMeter results + server metrics = complete picture.
Course Complete!
Congratulations! You've learned to:
- Understand why performance testing matters for e-commerce
- Build JMeter test plans from scratch
- Configure realistic load patterns with thread groups
- Handle dynamic data with correlation
- Create data-driven tests with parameterization
- Validate responses with assertions
- Design complete e-commerce test scenarios
- Test APIs including JWT authentication
- Analyze results and identify bottlenecks
- Run distributed tests and integrate with CI/CD